Wranx’s analytics provides powerful insights into how your learners are using Wranx and how they are progressing through their training.
Analytics is split into separate dashboards which are made up of ‘widgets’
There is also an export feature, allowing you to export valuable data about learners and user cohorts in various formats.
To continually improve learning within your organisation, you need to be able to have sight of all aspects of learning performance. This becomes possible with dashboards and reporting focused on the different and specific areas of learning. Wranx uses dashboards to give you visibility of the learning performance for your individual employees, your organisation as a whole and the different learning topics within your organisation.
The success of employee learning can’t be measured just through sales or your company’s bottom line. You need to measure specific metrics to understand how well your training is going and where to focus attention. Wranx tracks metrics like employees’ engagement, their performance on different topics and how confidently they answered different questions, with filtering by division, team or individual.
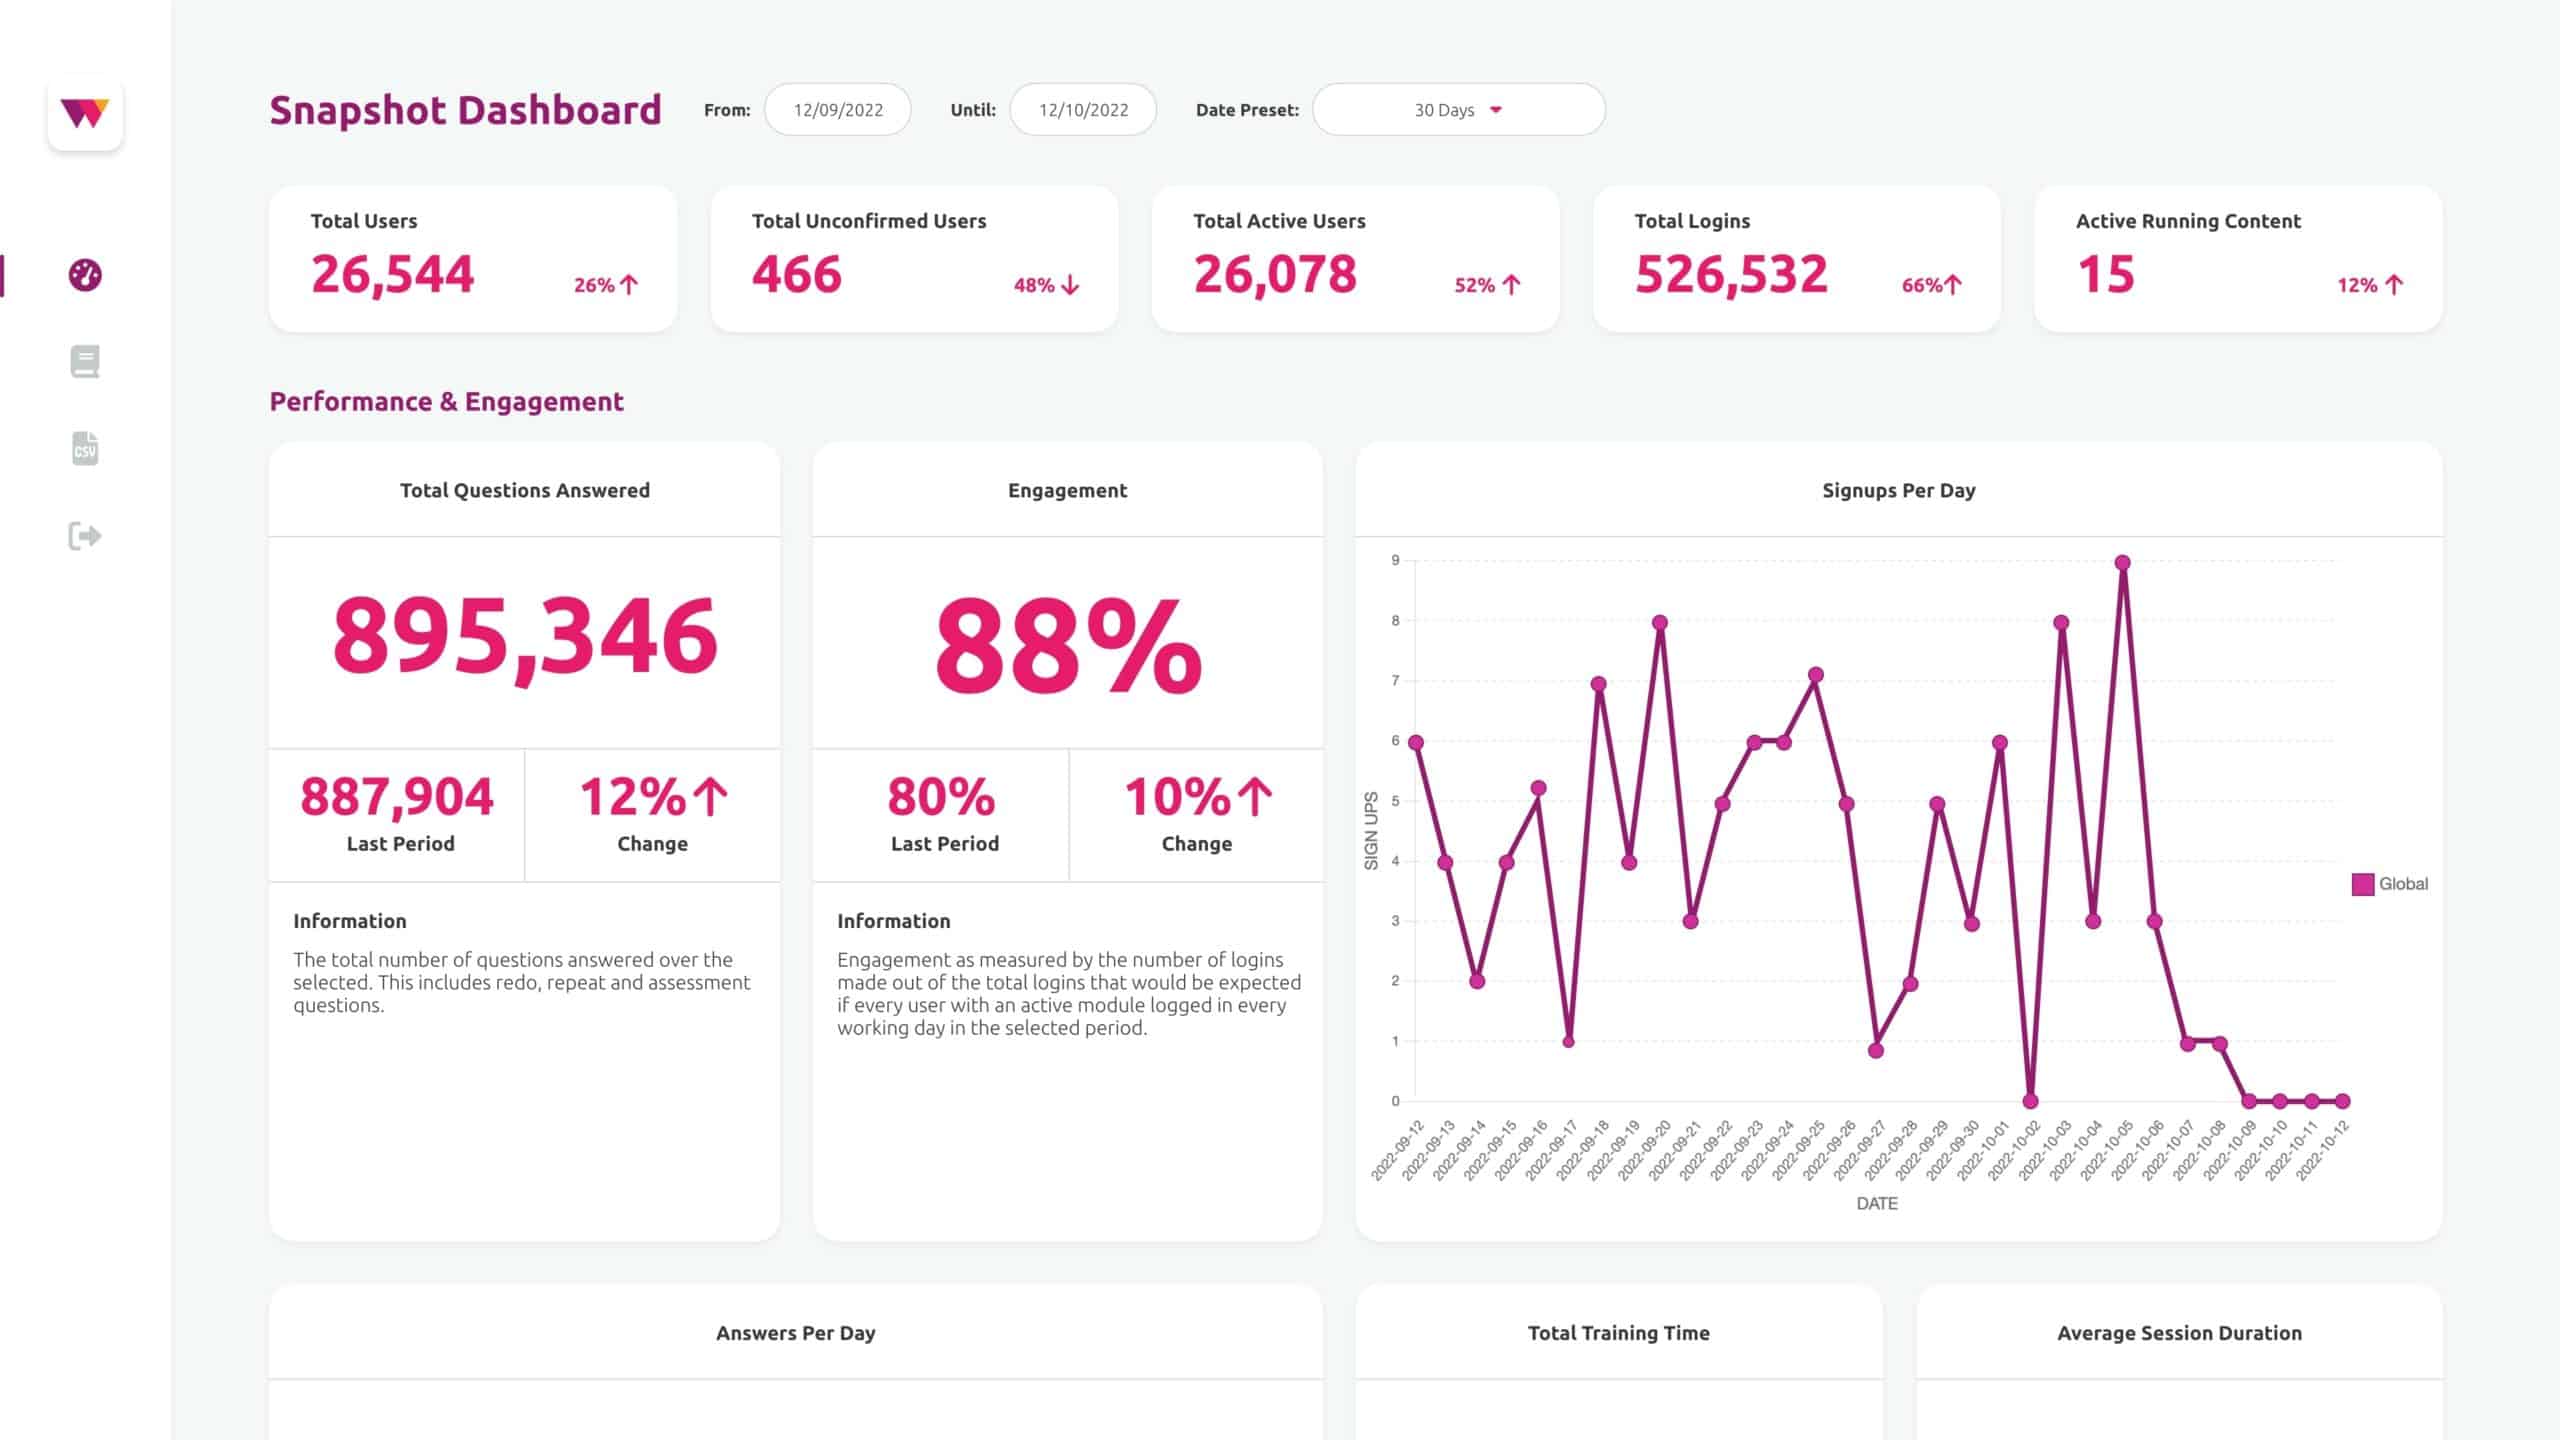
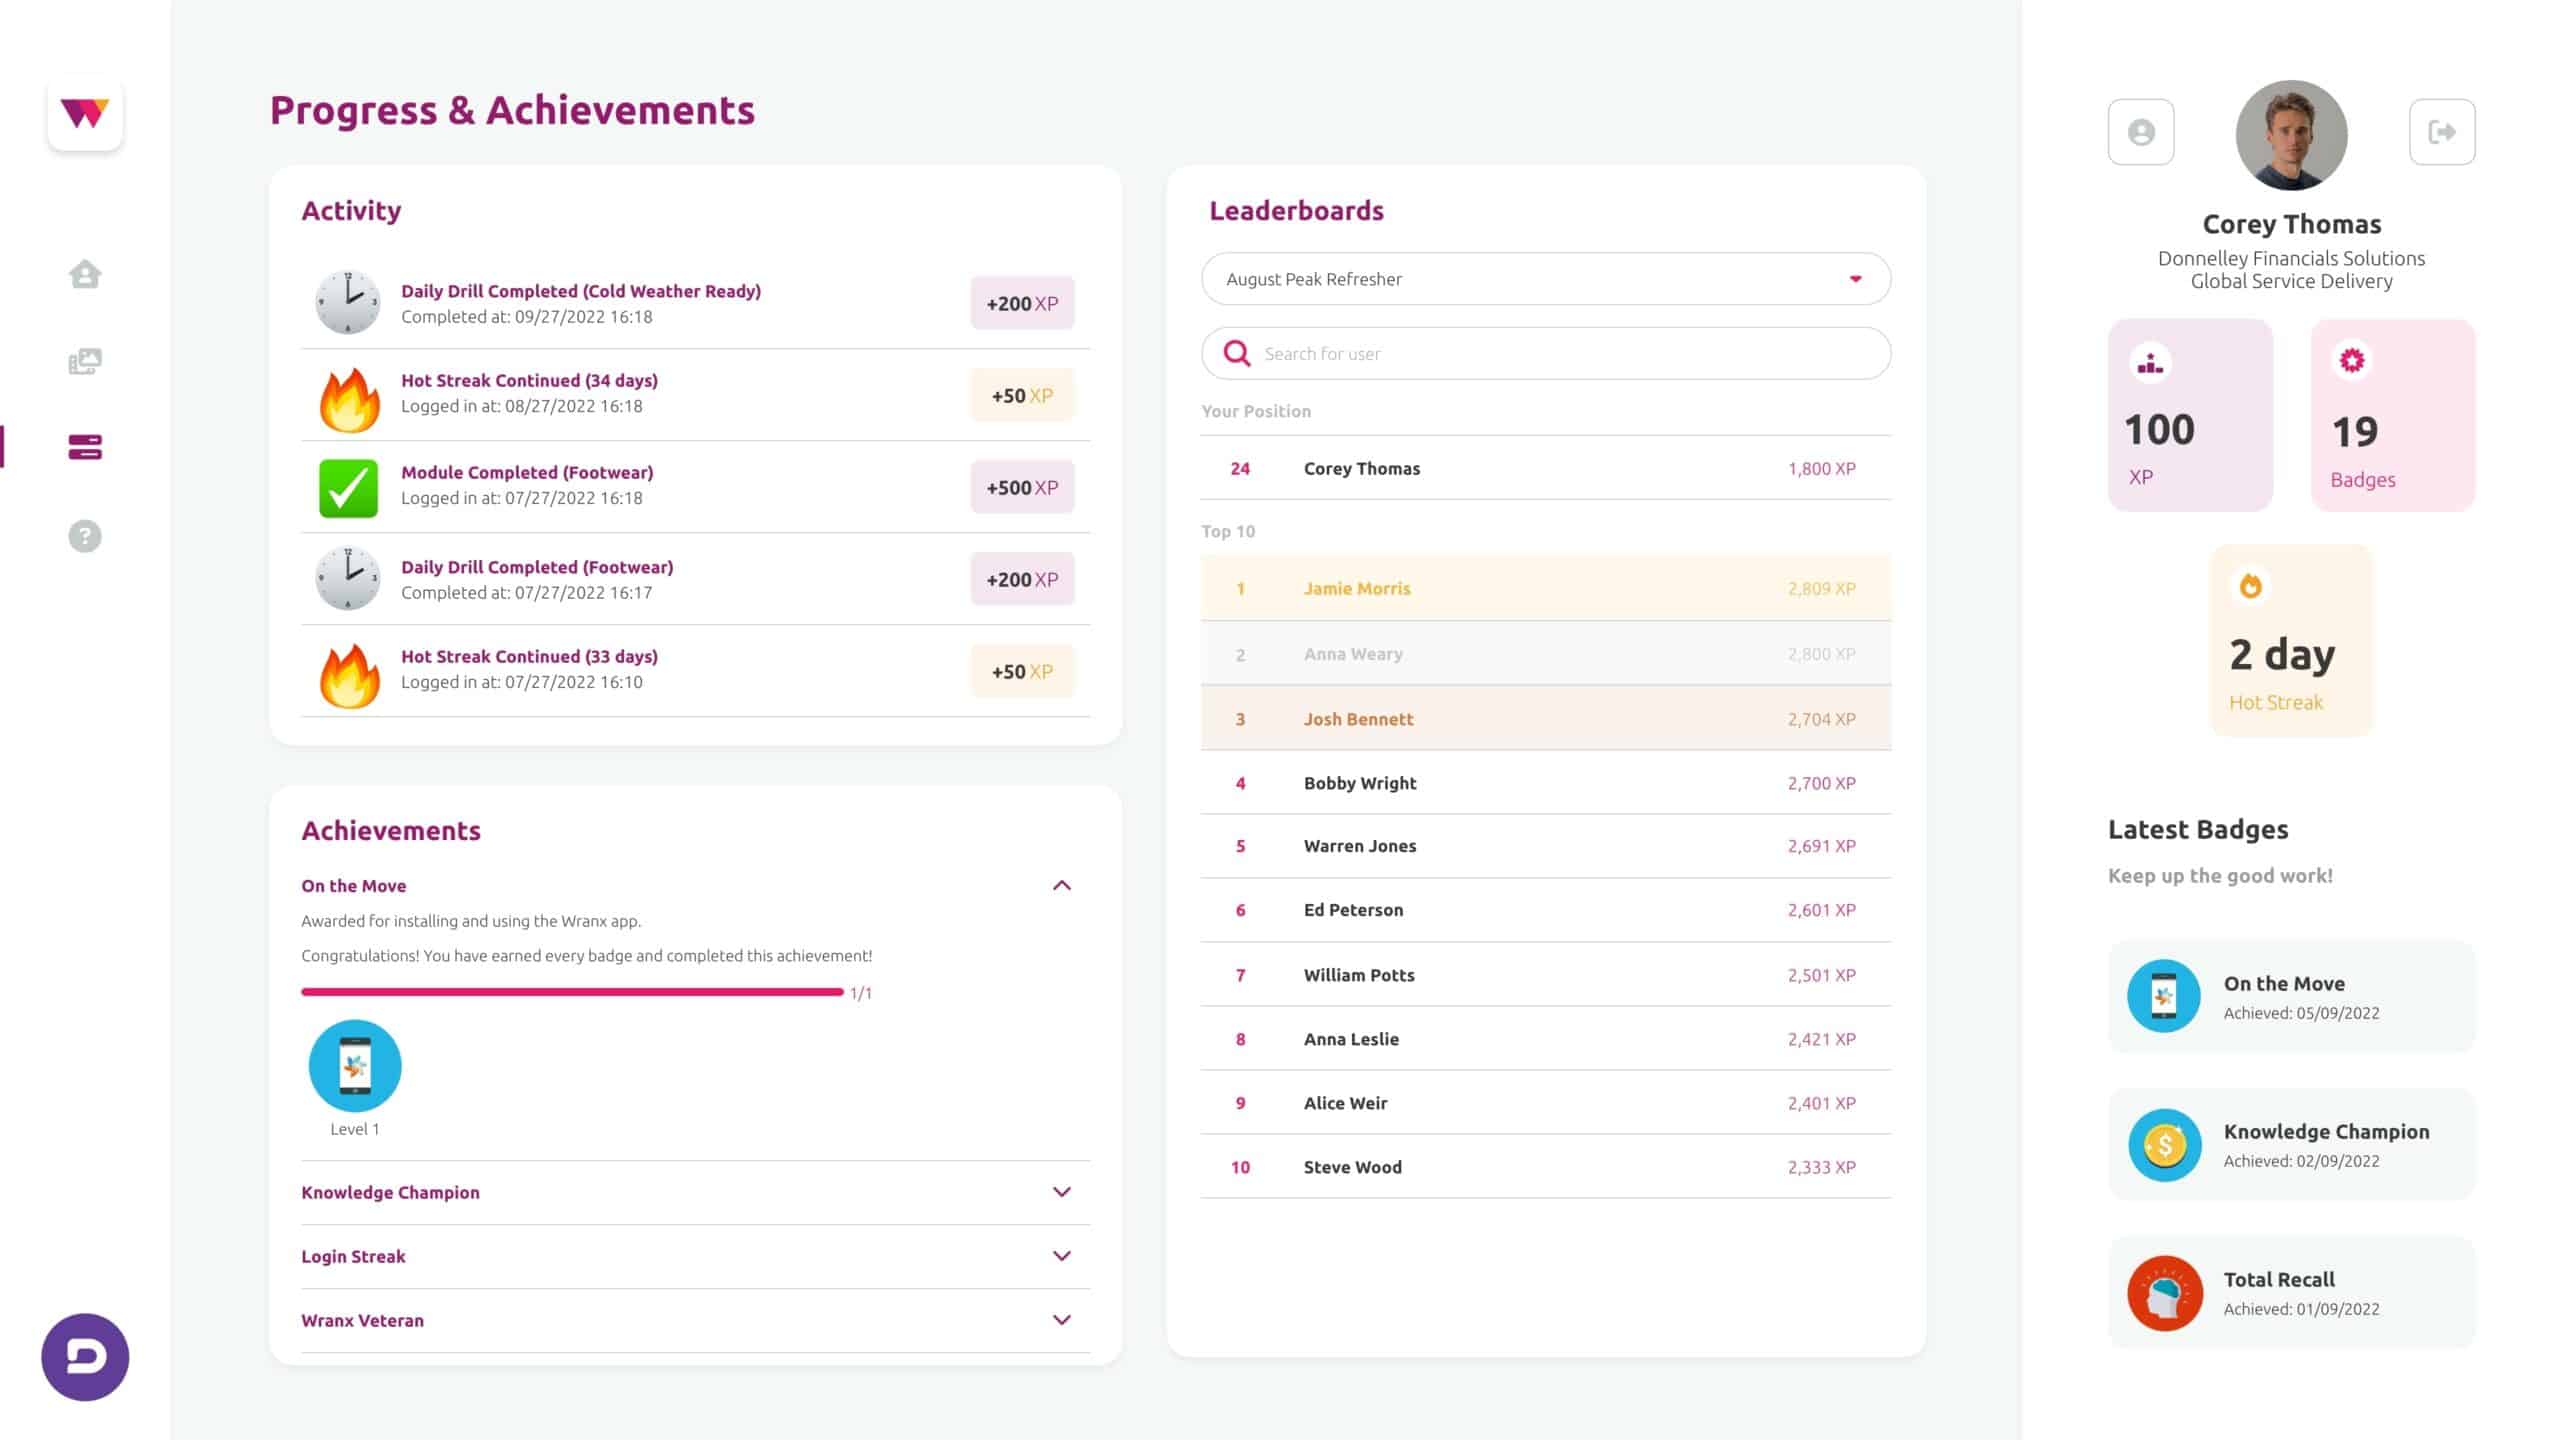
The dashboards provide a general overview of all users and cohorts, their engagement levels and how they’re progressing within the Wranx platform.
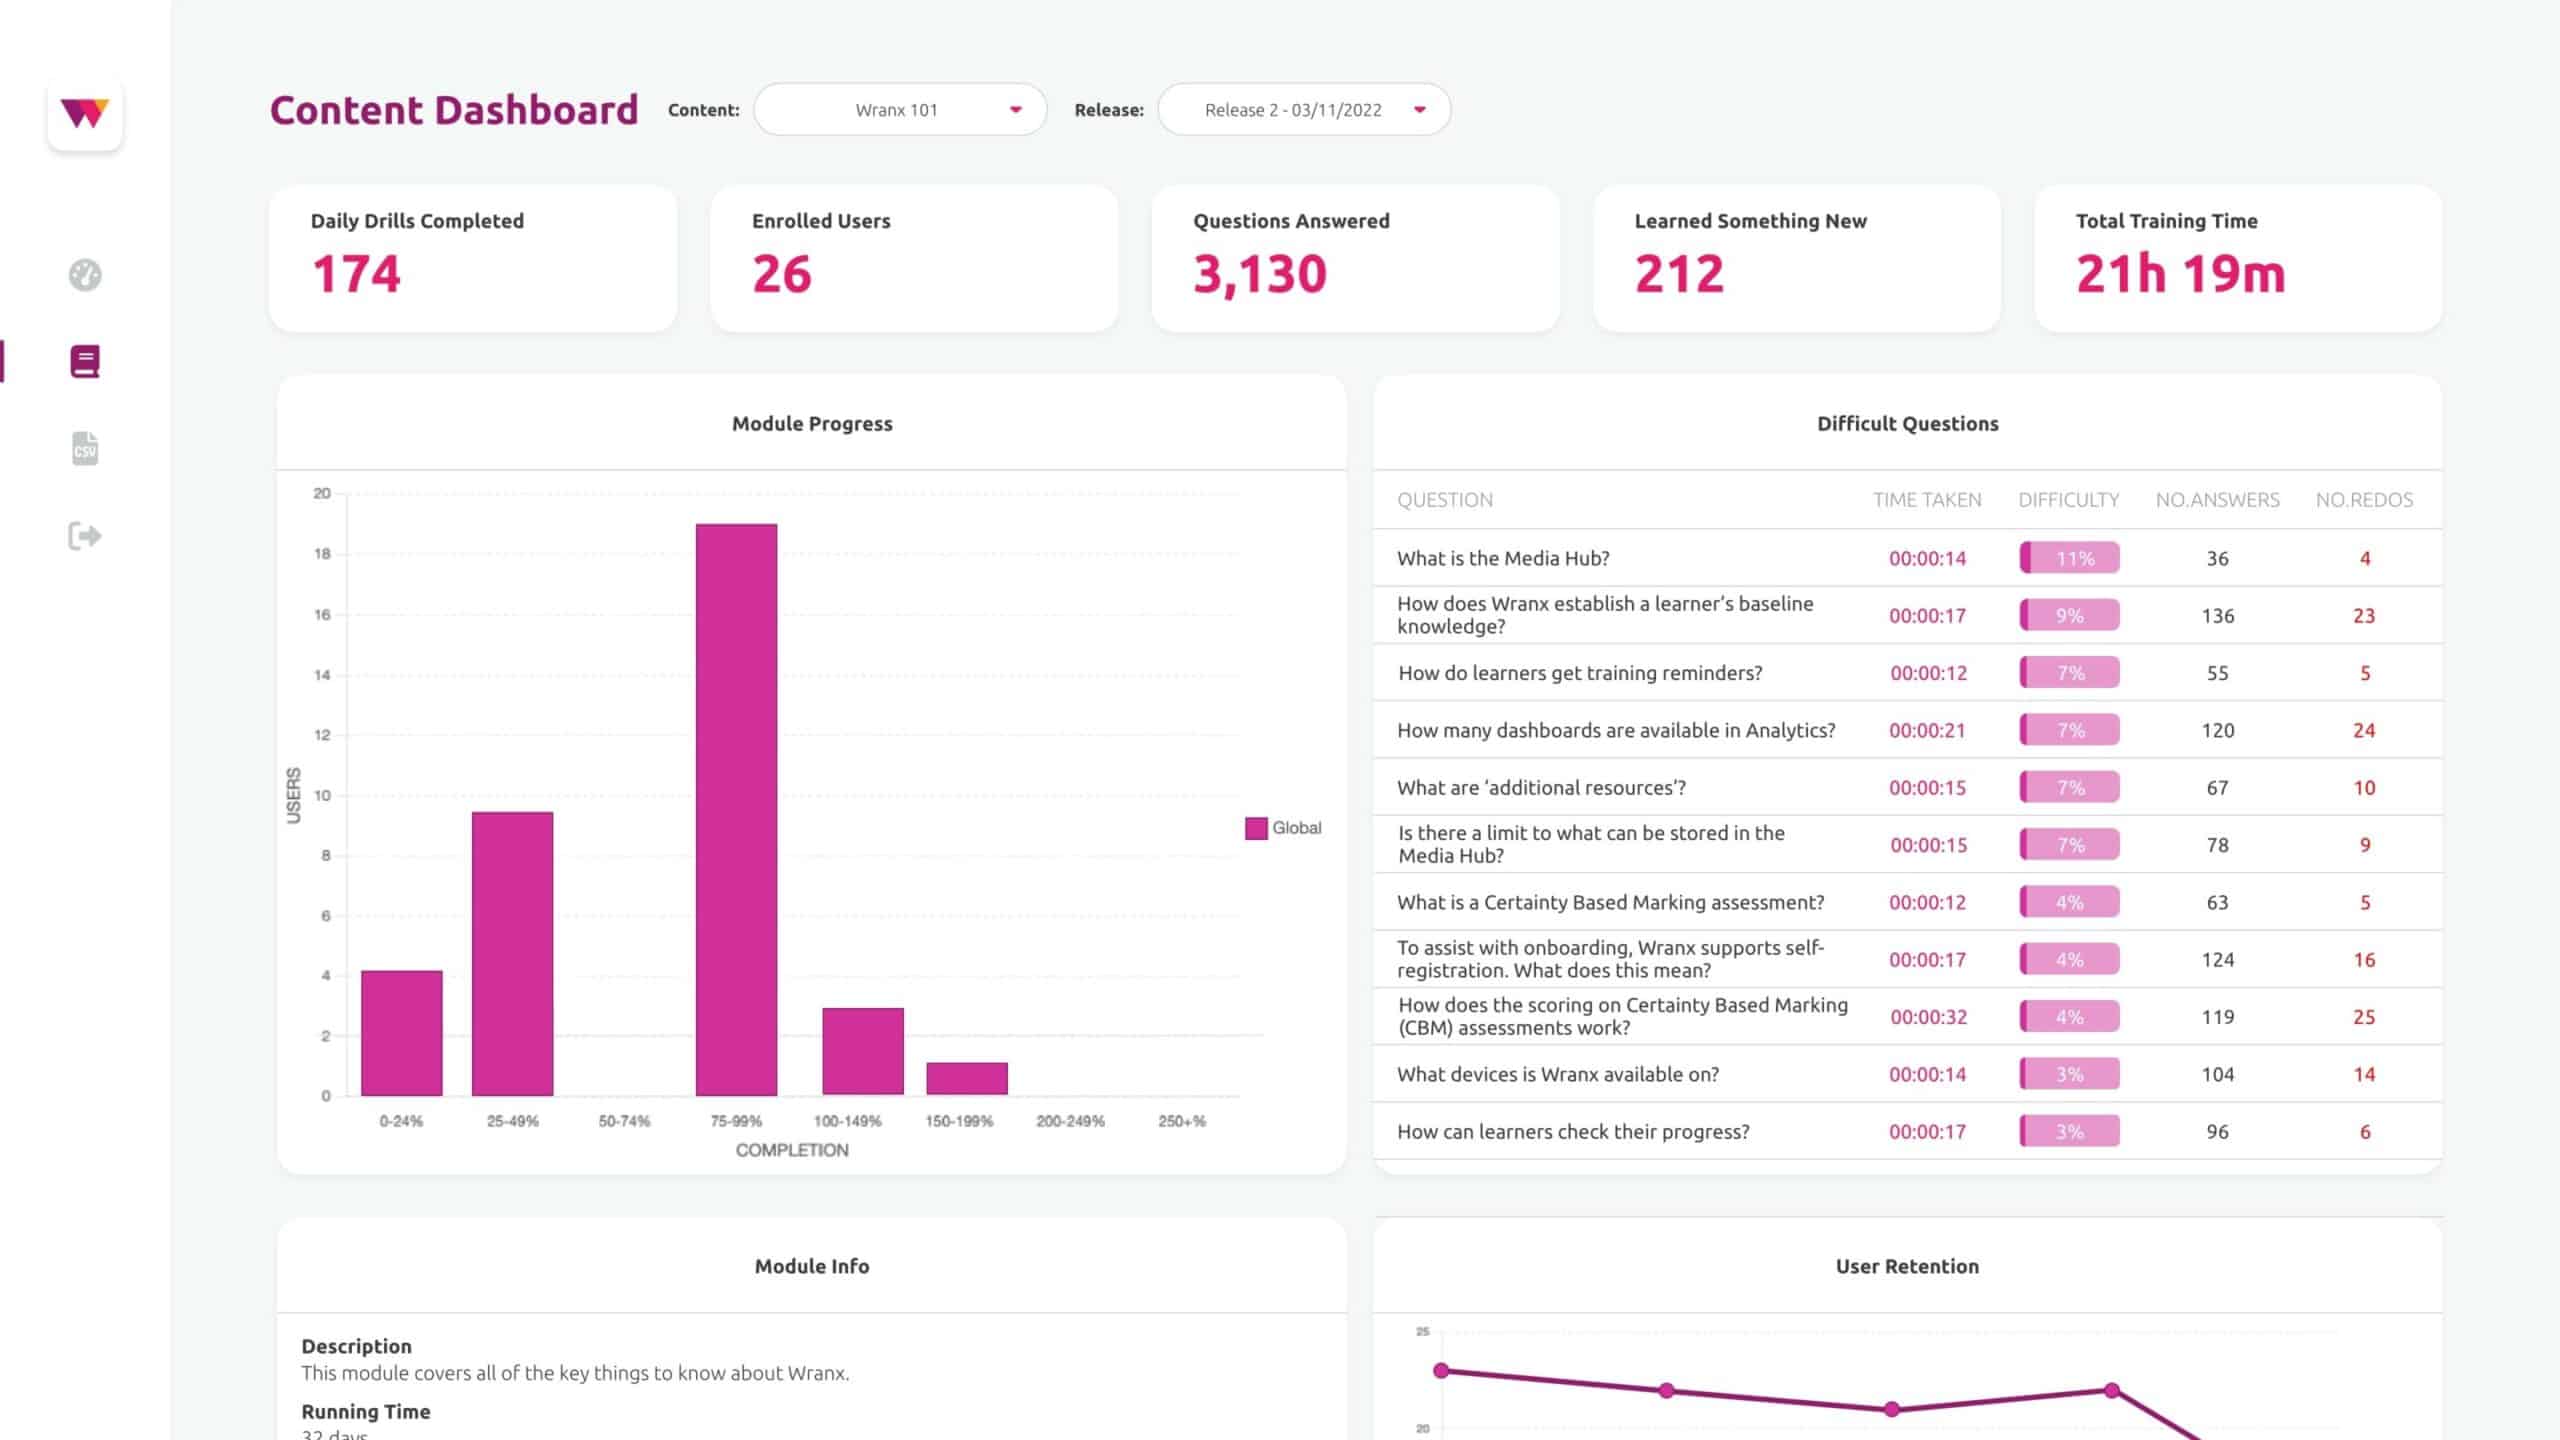
Metrics related to a specific release of a module, including the number of learners who are enrolled, how many active learners there are and the specific progress users are making through the module.
We also focus on metrics that reveal how your learner base is interacting with Wranx and how often.
This can provide insights into the training available and also which users may need reminding to complete their training. It also plots learners onto the “Knowledge Quadrant” helping you identify remaining knowledge gaps and the users with the most pressing training needs.


